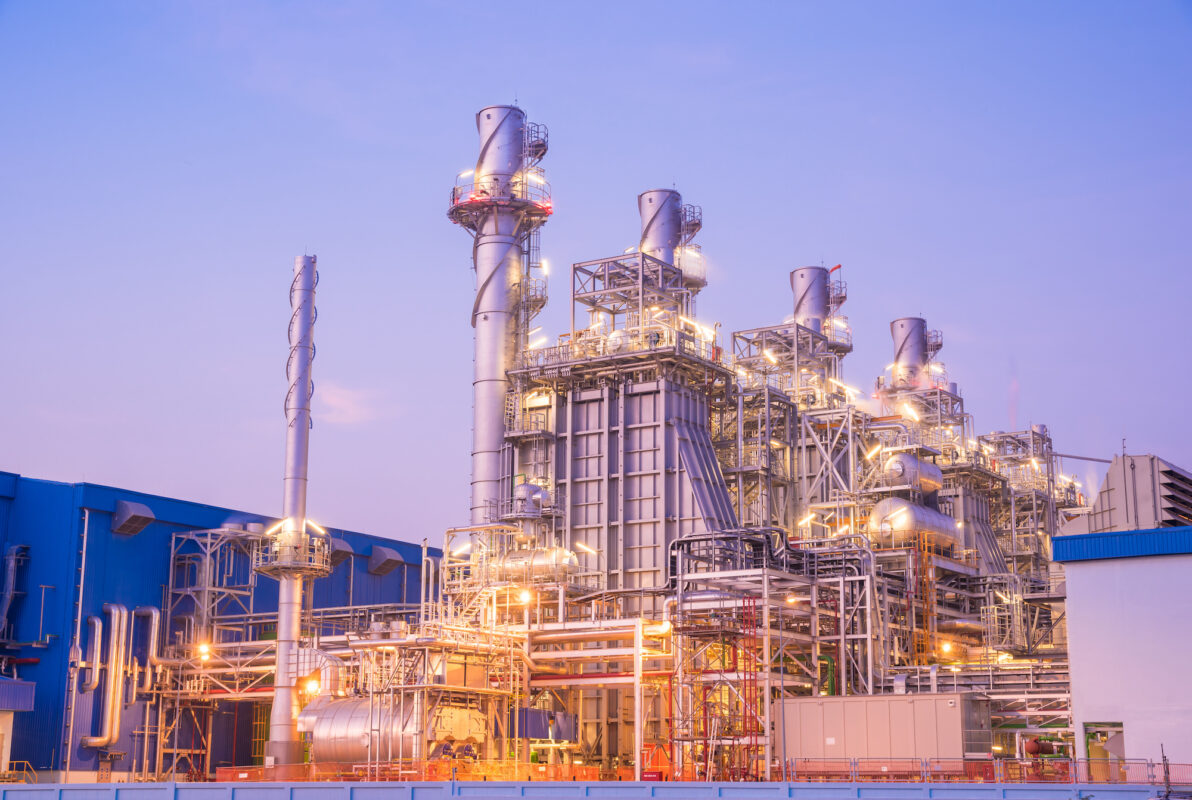
Is Wet Compression Safe for Gas Turbines? Proven Success with MeeFog Systems
Blog: Are outdated concerns costing your plant millions in potential profits? Discover why MeeFog wet compression sy...
Existing Customers Call 626-359-4550 Or Visit Customer Care
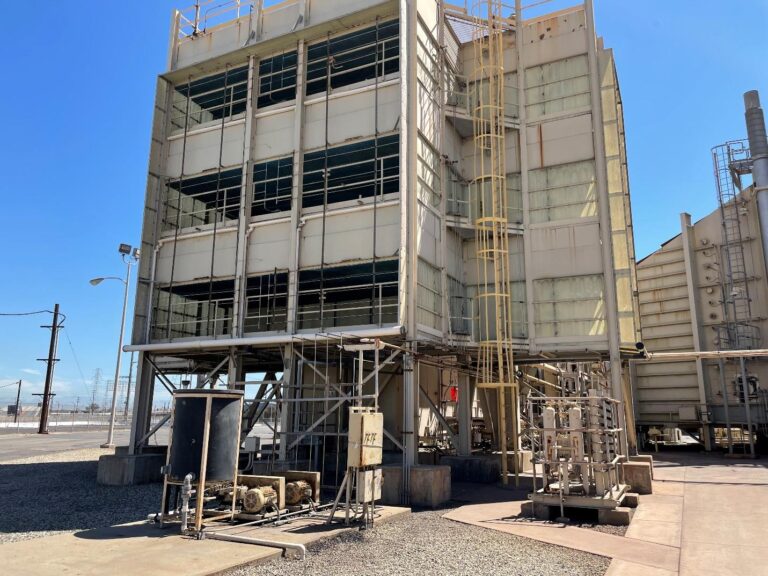
Gas turbine inlet air fogging has been used for more than twenty-five years and has been employed on more than 1300 gas turbines around the world. Fogging consists of spraying very small water droplets into the inlet airflow to cool the air by evaporation. Inlet fogging increases gas turbine power due to the fact that cooler air is denser, so the mass flow of the working fluid increases, and because the compressor is more efficient at lower air temperatures.
Many magazine articles giving user experiences with inlet fogging systems have been published (e.g. Schwieger, 2008). Operators have also replaced media-type evaporative coolers with fogging systems, which can give more cooling and an improvement in heat rate due to the fact that fog systems impose a negligible pressure drop on the inlet airflow (Ingistov, S., Chaker, M.,2011). Fog systems also have the added advantage of allowing an operator to control gas turbine output by adding or removing fog nozzle stages, whereas evaporative coolers are either on, providing maximum evaporative cooling, or off, providing no cooling.
Fogging can also be used to provide an additional power increase by intentionally spraying more water than will evaporate in the inlet air—commonly called wet compression, overspray or high fogging. “Over-spray” water droplets evaporate inside the compressor where they produce an intercooling effect (Hill, 1963). Wet compression reduces the work of compression per unit of compressor pressure ratio (Wang and Kahn, 2012), and there is a small increase in the mass flow of the working fluid. Wet compression has been shown to produce a significant increase in gas turbine output. Injecting fog at a rate of one-percent of the air mass flow will provide about a five-percent increase in the output of a heavy industrial gas turbine. A fog flow rate of one-percent is enough water to provide about 25°C (45°F) of evaporative cooling in extremely hot and dry air with a concurrent twenty-percent increase in gas turbine output so the power boost per unit of water is less for wet compression than it is for inlet air cooling. Nevertheless, wet compression can produce a considerable power boost and a significant economic benefit.
Wet compression has been successfully applied on hundreds of gas turbines around the world and has been used commercially for nearly 25 years with good results. When done properly, compressor blade erosion—from liquid impaction erosion—is eliminated or minimized to acceptable levels. Several gas turbine original equipment manufacturers offer evaporative cooling and overspray-fogging systems. Power boosts from a combination of gas turbine inlet air cooling and wet compression can be nearly as much as the power boost produced by other inlet air cooling methods for gas turbines like inlet air chillers for a fraction of the capital and operating costs and the return on investment can be better than inlet chillers (Bhargava, 2012).
This blog will explore the use of inlet air fogging in humid environments and show techniques for using Typical Meteorological Year data to get accurate estimates of annual output gain, and of the water and electrical consumption of the fog system. The city of Kuala Lumpur, Malaysia is used as an example because it is one of the most humid cities in the world.
Many inlet fogging installations are in very humid environments and experience shows they produce significant power gains. Yet there continues to be a misconception that fogging only works well in dry climates.
Relative humidity expresses the amount of atmospheric moisture relative to the amount of moisture that would be present in saturated air at the given temperature. If total moisture content is held constant while temperature is increased, the relative humidity of an air sample will fall. For example, air at 35°C (95°F) and 50% relative humidity has the same total moisture content as air at 23°C (73°F) and 100% relative humidity. High ambient humidity levels do limit the amount of evaporative cooling that can be accomplished, which in turn limits the power boost available. However, on a hot afternoon, it is always possible to do a significant amount of evaporative cooling even at locations with high humidity.
The misconception about evaporative cooling in humid climates may be partly due to the fact that relative humidity is often reported as an average for a given day or month. For example, the Wikipedia article on Kuala Lumpur gives climate data for each month of the year. June is reported to have an average high temperature of 33°C (91°F) and an average low of 23°C (73°F). Humidity is reported as 80%, without saying if it is an average, or the average high, etc.
It is actually quite rare for the relative humidity to be 80% on a hot afternoon. Figure 1 shows the typical Kuala Lumpur climate plotted on a psychrometric chart with colored boxes showing the typical hours of occurrence for each psychrometric condition. The red dot is at 32°C and 80% relative humidity, which falls outside of the typical range of climatic conditions for Kuala Lumpur. Figure 1 shows that it is sometimes possible to cool by more than 10°C, which would give about a 7% power increase for a typical industrial gas turbine.
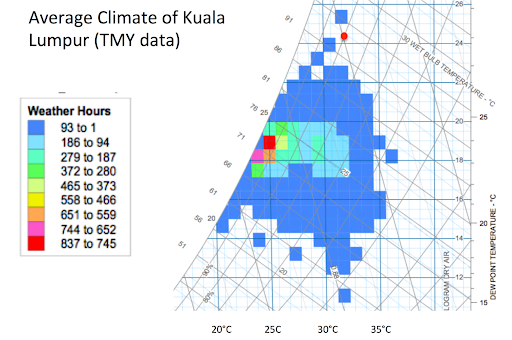
Figure 1: Gas turbine inlet fogging system design considerations
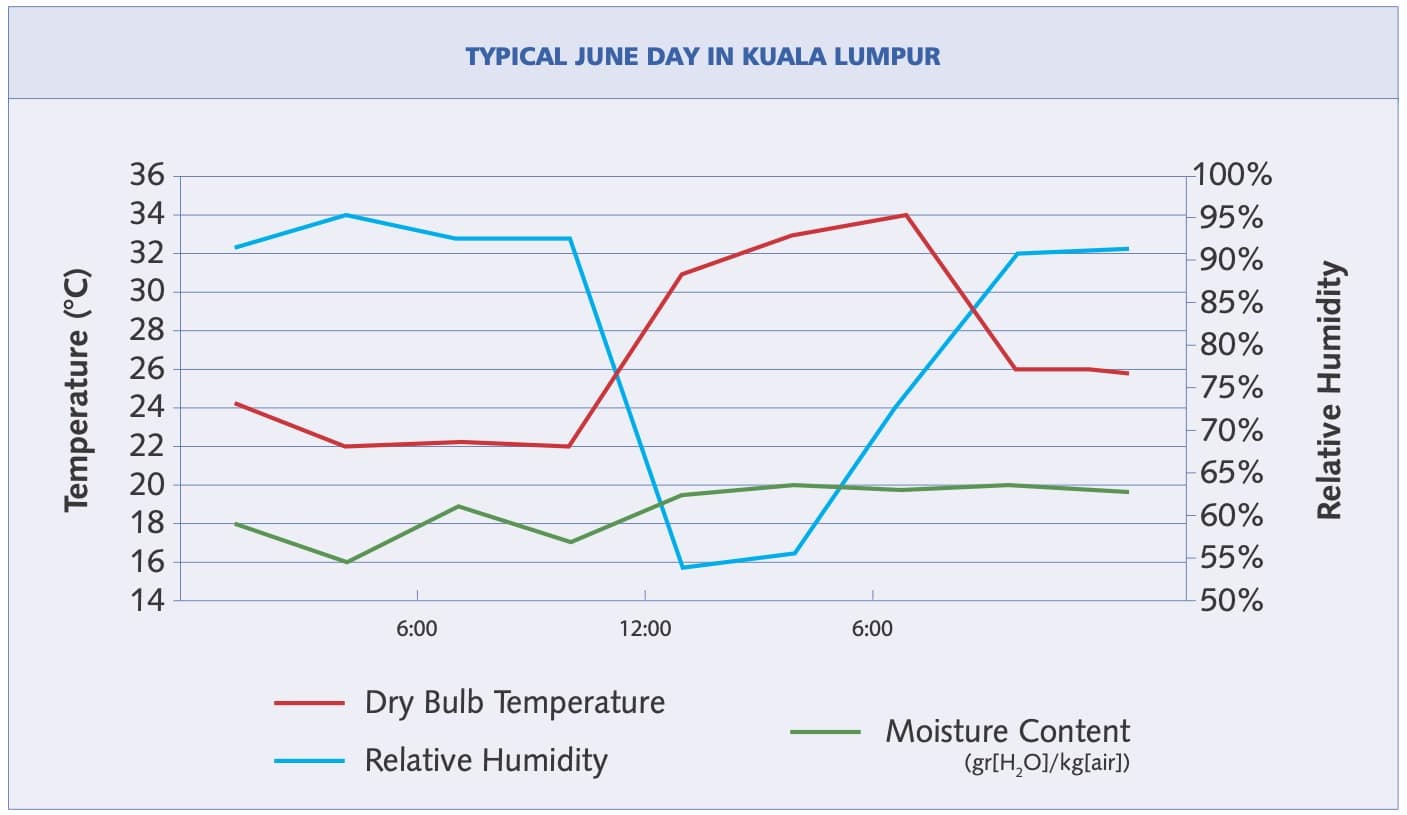
Figure 2: Mid-day relative humidity
The saturation pressure of water vapor increases non-linearly with temperature. Note how the 100% relative humidity curve in figure 1 increases steeply for small increases in temperature. This means that there can be far more atmospheric water vapor present when air is hotter.
Total water vapor content does not usually change much over a given day but the steep increase of the saturation curve with increasing temperature, means that much more water can evaporate when the temperature is higher. Therefore, the lowest relative humidity nearly always occurs in the hot afternoon, and the highest relative humidity usually occurs late at night. Figure 2 shows this phenomenon—relative humidity (the blue line) begins to decrease as the temperature (red line) begins to rise. Note that the relative humidity decreased significantly even though total moisture content went up—from 16 gr (water)/kg (air) in the early morning to 20 gr/kg in the late afternoon.
Water molecules (H₂O) have a neutral charge because they have an equal number of protons and neutrons. However, the oxygen atom attracts electrons slightly more strongly than the hydrogen atom so there is a slightly negative charge near the oxygen atom and a slightly positive charge near the hydrogen atoms. This means the positive end of one molecule is attracted to the negative end of another molecule giving liquid water a degree of cohesion. The polar nature of water also makes it a strong solvent—it attracts both negative and positive ions. However, if sufficient heat is added to the fluid—the latent heat of vaporization—the intermolecular cohesive forces are overcome and individual molecules can escape the surface of the fluid. Evaporation increases with increasing temperature because the kinetic energy of a molecule is proportional to its temperature and more energetic molecules are more likely to have sufficient energy to break the intermolecular bonds and exit the fluid.
When an energetic molecule leaves a liquid, the remaining liquid molecules have lower kinetic energy so the liquid cools. Water molecules are constantly entering and exiting liquid water surfaces but if the number of molecules leaving and returning reaches equilibrium, the space above the fluid is said to be saturated with vapor (100% relative humidity). When humid air is cooled, the evaporation process reverses. The number of vapor molecules entering the liquid exceeds the number of molecules leaving the liquid and the latent heat is converted back to sensible heat—the heat of condensation. It is sometimes said that hot air can hold more water vapor but this is a misstatement because air doesn’t “hold” vapor. It’s just that a hotter liquid has more molecules that possess sufficient kinetic energy to break their intermolecular bonds so more molecules tend to leave the surface.
Intermolecular cohesive forces also cause surface tension. Molecules at the surface have fewer neighbors—no neighbor above—so the charge is spread over fewer connections and they cohere more strongly to their neighbors. Surface tension may play a larger role in the evaporation process than was previously thought. The heat of vaporization of substances has been determined empirically and several equations have been developed. However, there has not been consensus on the exact physical processes involved and multipliers were required to make the equations fit experimental results (Garai, 2009). Garai proposed a model for calculating the heat of vaporization from first principles, which shows good agreement with experimental results. According to Garai, the energy required to liberate a molecule from a liquid surface is equivalent to the energy required to break the surface tension (figure 3).
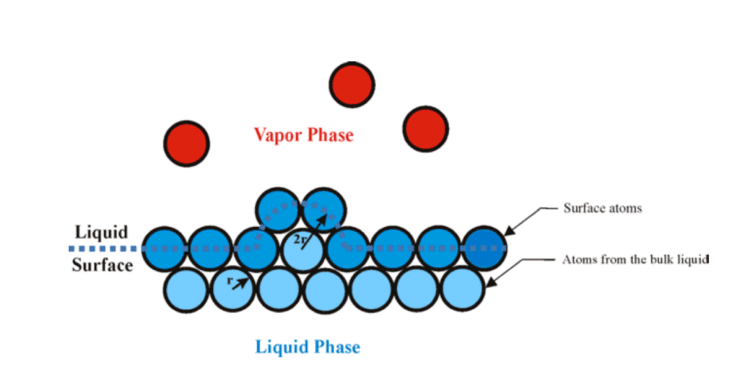
Figure 3: Inlet air cooling methods for gas turbines require small droplets for large surface area
The relationship between surface tension and the heat of vaporization is well known. Water, for example, has a high heat of vaporization and a high surface tension, while ethanol has a low heat of vaporization and a lower surface tension (figure 4).
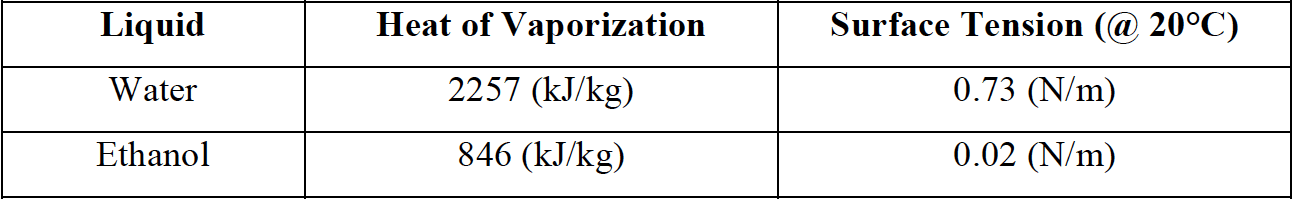
Figure 4. Heat of vaporization & surface tension for water and ethanol
Another recently published study seeks to explain both the heat of vaporization and the critical point in terms of kinetic energy and surface tension (Mayhew, 2013). Rather than considering only single collisions of particles in a fluid, Mayhew shows that the latent heat of vaporization can be supplied through the collision, in an infinitesimal instant of time, of all of the neighboring molecules with the vaporizing molecule. This gives the vaporizing molecule the energy necessary to break the surface tension of the liquid.
Mayhew’s theory seems to answer the question of why atoms or molecules on the surface of a liquid tend not to be the ones to evaporate —they have fewer neighbors. For fog droplet evaporation, the hot air molecules surrounding a fog droplet supply the heat of vaporization, so the air is cooled as the droplet evaporates. Mass is transferred but energy is conserved, which means there is no change in the enthalpy—or total heat—of the air/vapor mixture. The heat used to vaporize the water droplet is “latent” in the air/vapor mixture while the “sensible” heat of the air is reduced. Textbook explanations of evaporation seem likely to change in the near future. Nevertheless, we can say in simple terms that evaporation requires energy. If rapidly vibrating air molecules supply that energy, the air molecules lose some of their kinetic energy so the air cools.
The wet-bulb temperature is the temperature reached if water is evaporated to reach saturation in non-saturated air. The potential for evaporative cooling is defined as the dry-bulb temperature minus the wet-bulb temperature—often called the wet bulb depression. As water droplets evaporate, the air is cooled due to the latent heat of vaporization but evaporation stops when the wet bulb temperature is reached.
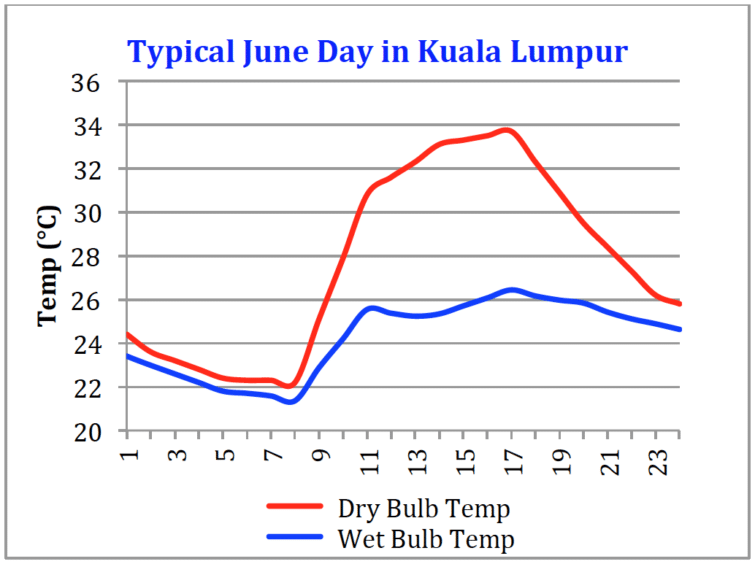
Figure 5: Tracking mid-day evaporative cooling for gas turbine inlet fogging
Figure 5 shows the wet bulb depression for Kuala Lumpur on the same typical day as Figure 2. The wet bulb depression is about 8°C (14°F) at 16:30 hours. The output increase for a typical industrial gas turbine with 8°C of cooling is about 6%. In a desert environment, power boosts of more than 20% are possible but a 6% power boost still gives a significant economic benefit due to the low capital and operating costs of inlet fog systems
Typical Meteorological Year (TMY) data is a collection of meteorological data for specific locations around the world that gives hourly data for a “typical” year. The data sets were developed to compare different methods of indoor climate control for buildings. They are also used for making calculations for renewable energy conversion systems such as solar photovoltaic installations. TMY data sets are not suitable for sizing equipment because they represent typical climate conditions, not extremes. The data sets were constructed using 30 years of measured weather data. The hourly weather data used are actual measured data, interpolated or in-filled using data from nearby stations if actual data was not available.
Sandia National Laboratories produced the first TMY data sets for the United States in 1978 (S. Wilcox and W. Marion 2008). Typical or representative months were selected using algorithms developed at Sandia (Hall et. al 1978). These “typical” months are then concatenated to form a typical meteorological year. The most up-to-date TMY data set (TMY3) was compiled by the U.S. Department of Energy’s National Renewable Energy Laboratory and is available on the Internet.
TMY data are well suited for making analyses of the economic benefits of inlet air fogging for gas turbines because they represent a typical year and are therefore more likely to give a reasonably accurate picture of the average benefit that can be expected over a period of many years. Climate is highly variable on daily and annual scales so no future year will be exactly the same as a typical year. However, TMY data does allow a reasonably accurate estimation of what can be expected from an inlet air fogging system for a typical year in the future. TMY data can be used to construct a chart showing Evaporative Cooling Degree hours (ECDH) for a given power plant site. A similar method was used to show evaporative cooling potential for different cities around the world (Chaker & Homji, 2002).
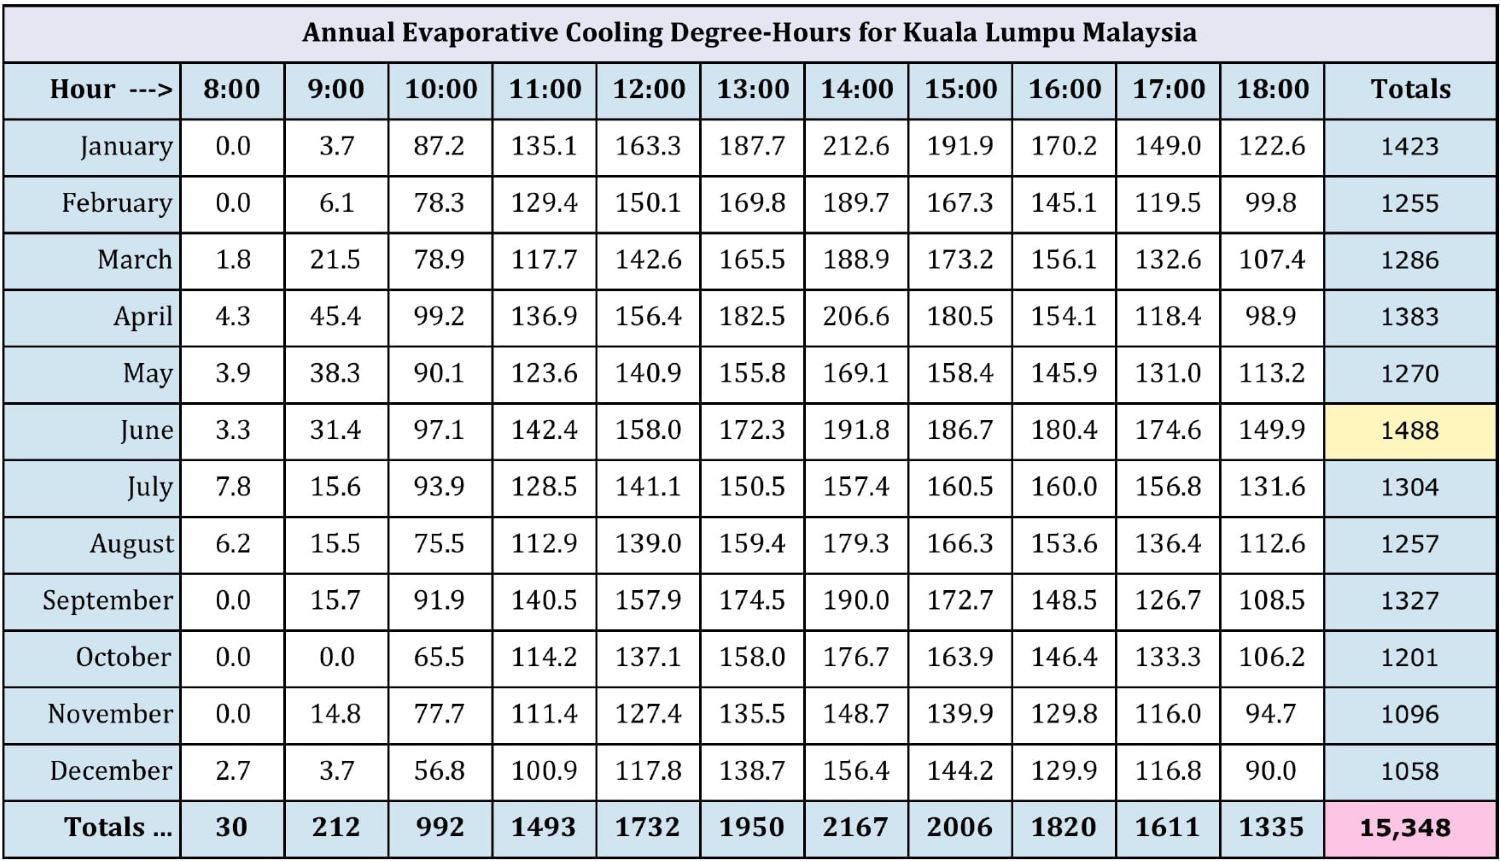
Figure 6: Climatic analysis of gas turbine evaporative cooling potential
Figure 6 shows the degree-hours of cooling possible for each hour of the day, for each month of the year. The amount of cooling is calculated by converting the TMY dry bulb and dew point data to wet bulb, then subtracting the wet bulb from the dry bulb to get potential cooling. This process is done for every hour of the year then presented as degree-cooling hours for each hour of the day for each month. In the example shown, degree-hours of potential cooling are not calculated if the ambient temperature was below 27°C (80°F), the assumption being that a power boost may not be required when the temperature is below 80°F. Cooling is also not calculated for cooled-to temperatures below 13°C (55°F) to ensure there will be no icing at the compressor inlet due to adiabatic cooling—although it is never possible to cool to such a low temperature in Kuala Lumpur. These assumptions can be changed to allow users to evaluate different scenarios. From the chart we can see that the month of June has the most potential for evaporative cooling—yellow highlight—and it is possible to do more than 15,000 degree-hours of evaporative cooling in a typical year.
Evaporative Cooling Degree-Hours, derived from TMY data, are combined with data characterizing the response of a particular gas turbine to changes in inlet air temperature and the water and power consumption of the fogging system. These calculations are done for each hour of the typical meteorological year. The fog system water and electrical power consumption are calculated based on the amount of cooling and the air-mass flow of the gas turbine.
Figure 7 shows the results for evaporative cooling on a GE-9EA gas turbine in Kuala Lumpur between 8:00 and 18:00 for every day of the year. The power boost produced by the fog system is 12,570 MW-hours. The fog system consumed 53,719 kW/hr of electricity—just 0.4% of the extra power produced—and it consumed 9,946 m3 of demin water. It’s important to keep in mind that the heat rate is also improved. Similar calculations can be performed for wet compression.
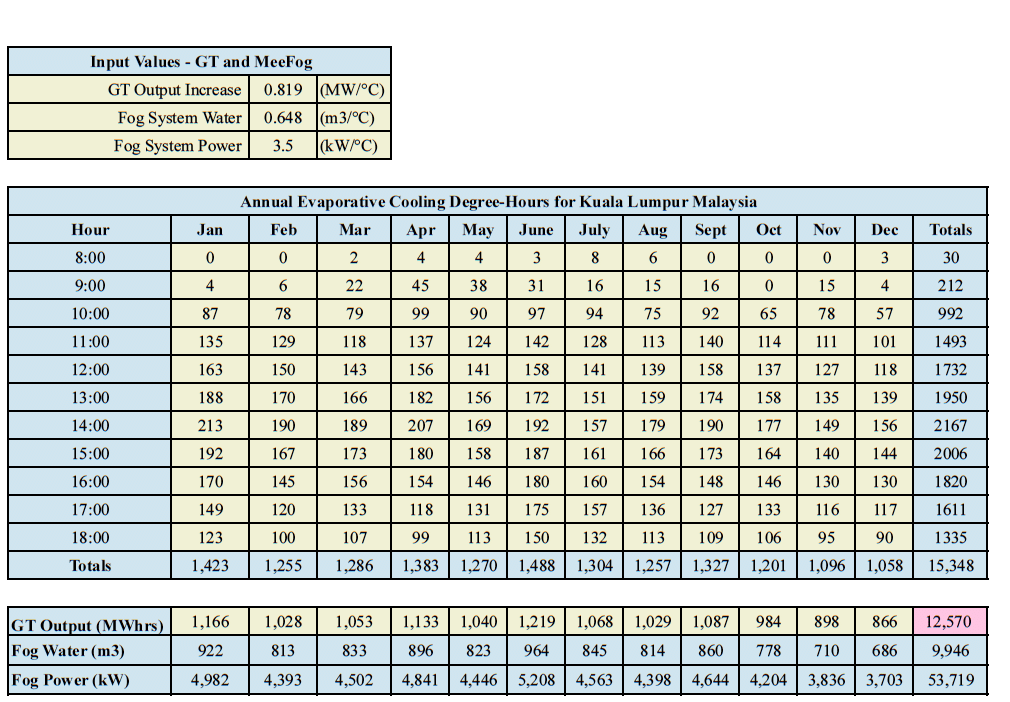
Figure 7. Performance of a fog cooled GE-9EA gas turbine in Kuala Lumpur
This paper seeks to illuminate facts showing that evaporative cooling with inlet air fogging can be effective and economically beneficial in humid environments. A computational tool that allows gas turbine operators to predict the benefits of inlet fogging using Typical Meteorological Year datasets was reintroduced. Gas turbine operators can use this information to make fairly accurate calculations of return-on-investment for a fog system. Further work is underway to develop web-based code that will allow gas turbine operators to use TMY data to quickly compute ROIs for their particular circumstances.
Ingistov, S., Chaker, M.; Upgrade of the Intake Air Cooling System for a Heavy-Duty Industrial Gas Turbine, Proceedings of ASME Turbo Expo 2011, June 6-10, 2011, GT2011-45398.
Hill, P.G.; Aerodynamic and Themordynamic Effects of Coolant Injection on Axial Compressors. Aeronautical Quarterly, November, 1963.
Wang T.,and Khan J. R., Discussion of Some Myths/Features Associated With Gas Turbine Inlet Fogging and Wet Compression. Proceedings of ASME Turbo Expo 2012 GT2012 June 11-15, 2012, Copenhagen, Denmark.
Bhargava R.K, Branchini L., Melino F. Peretto A.; Available and Future Gas Turbine Power Augmentation Technologies: Techno-Economic Analysis in Selected Climatic Conditions. Proceedings of ASME Turbo Expo 2012 GT2012 June 11-15, 2012, Copenhagen, Denmark.
Garai, Jozsef; Physical Model for Vaporization. Fluid Phase Equilibria, Volume 283, Issue 1-2, Pages 89-92.
Mayhew, K.; Latent heat and critical temperature: A unique perspective. Physics Essays, Volume 26: Pages 604-611, 2013.
Wilcox, S., and Marion, W., 2008; Users Manual for TMY3 Data Sets, NREL/TP-‐581-‐43156 Available at: http://www.nrel.gov/docs/fy08osti/43156.pdf
Hall, I., Prairie, R., Anderson, H., Boes, E., 1978; Generation of Typical Meteorological Years for 26 SOLMET Stations. SAND78-1601. Albuquerque, NM: Sandia National Laboratories.
Mustapha Chaker, Ph.D; Cyrus B. Meher-Homji, 2002. Inlet Fogging of gas turbine engines: Climatic Analysis of Gas Turbine Evaporative Cooling Potential of International Locations. ASME paper 2002-GT-30559, ASME Turbo Expo, June 3-6, 2002 Amsterdam, The Netherlands.